Revenue Composition
Six revenue lines span poultry, duck, rabbit, and circular fertilizer outputs.
Each modality feeds the OrganaCana network while balancing commodity risk: broilers and layers deliver steady cash flow, ducks differentiate premium supply, rabbits anchor value-add processing, and compost closes the loop for regenerative soil programs.
Figures reflect steady-state annual performance for a single OrganaCana Poultry & Rabbit Works campus.
- Chicken broiler $1.102M annual revenue 17.9% of total
- Chicken layer (eggs) $495K annual revenue 8.1% of total
- Duck broiler $1.463M annual revenue 23.8% of total
- Duck layer (eggs) $742K annual revenue 12.1% of total
- Rabbit meat $1.92M annual revenue 31.3% of total
- Compost & fertilizer $420K annual revenue 6.8% of total
Percentages round to the nearest tenth; totals reflect steady-state performance per site.
Financial Snapshot
$6.142M
Annual revenue per site once barns, processing, and distribution operate at capacity.
$3.892M
Pre-CAPEX earnings from the integrated livestock stack (63% EBITDA margin).
$7.0M
Interest-free, seven-year amortization aligned to repayment waterfalls.
19 FTE
Average compensation ~$54.9K plus $20K in profit share through the pool.
7 years
Post-repayment net profit climbs to ~$4.89M annually, boosting all profit-share buckets.
6 primary lines
Six-line mix spanning chicken broilers, chicken layers, duck broilers, duck layers, rabbit meat, and compost products to diversify cash flow.
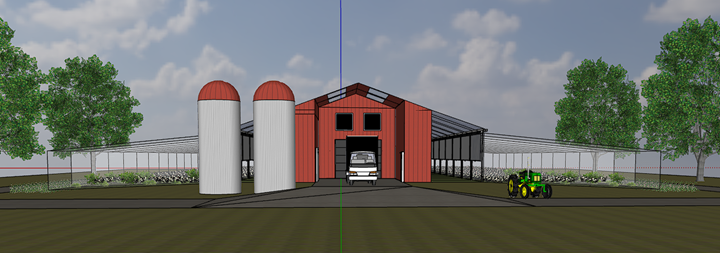
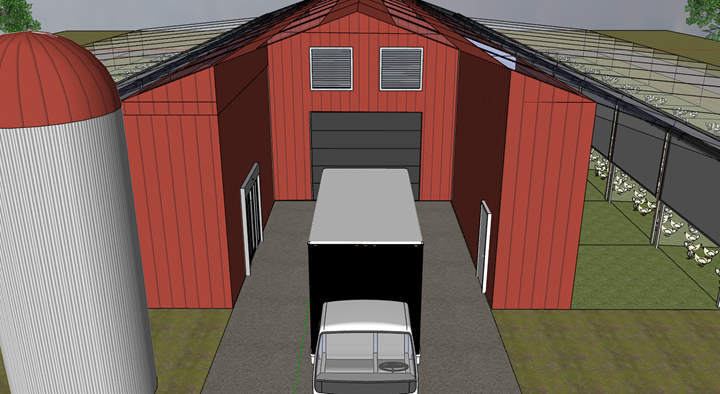
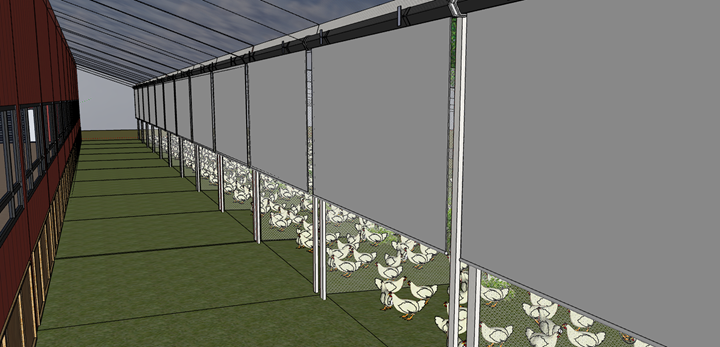
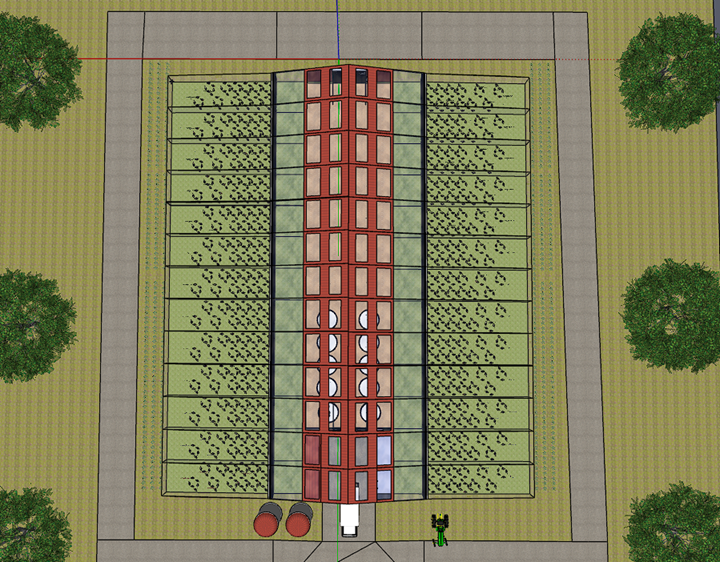
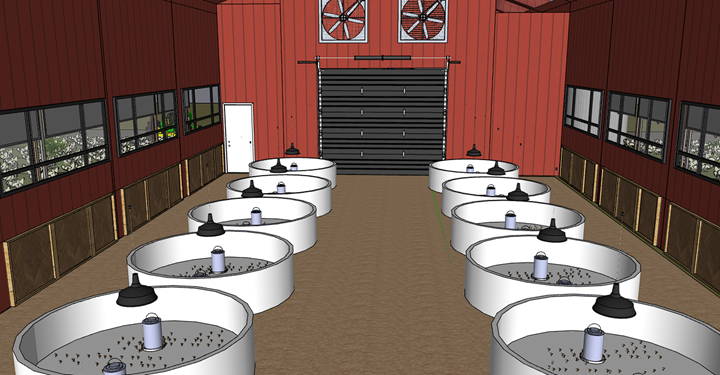
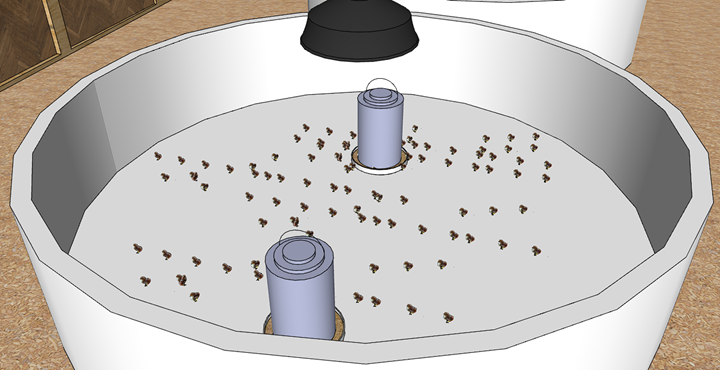
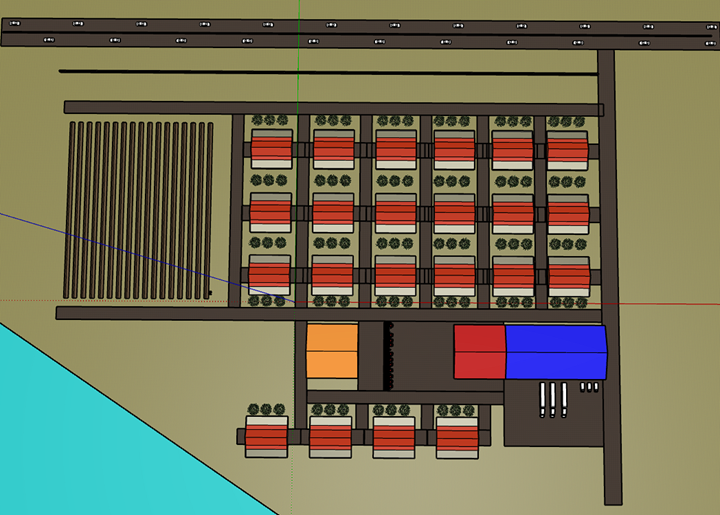
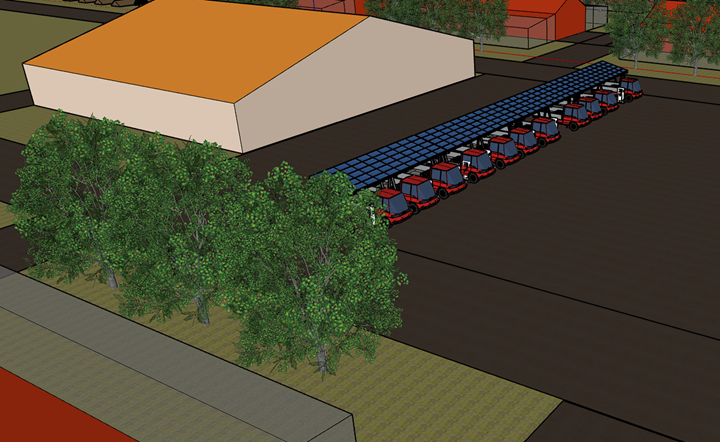
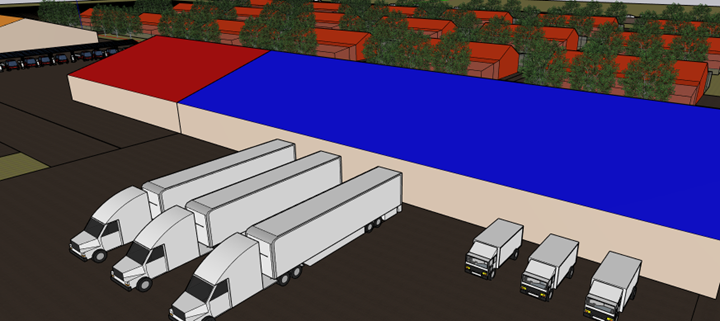
Project Images
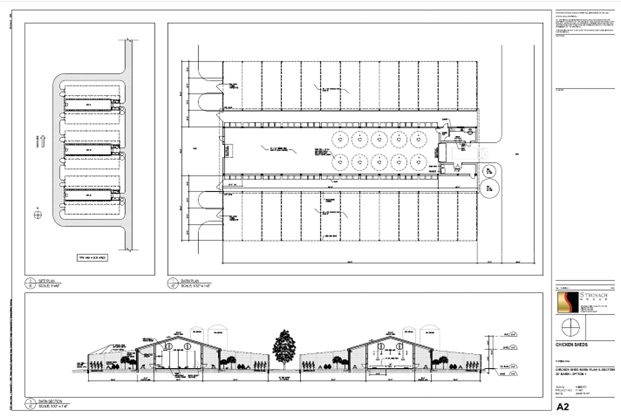
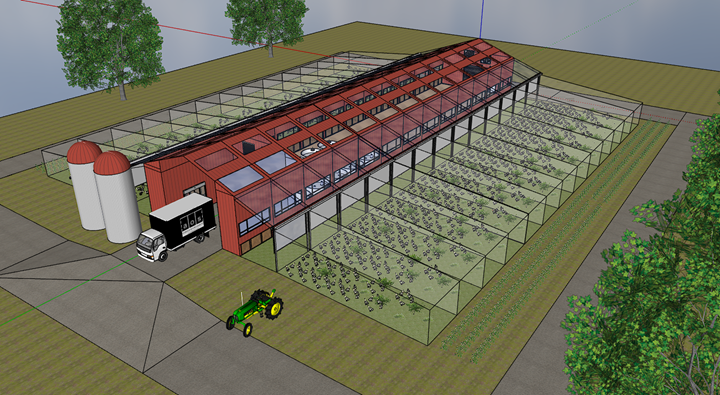
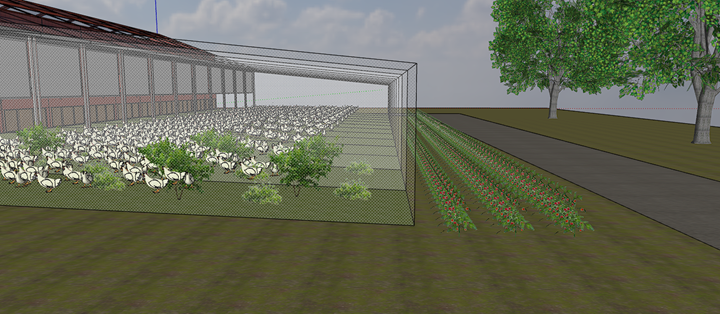
1. Investment Highlights
-
Closed-loop revenue stack
Poultry, duck, rabbit, processing, logistics, and fertilizer combine into a diversified cash engine under one roof.
-
Quota-backed growth
New Entrant approvals and OrganaCana mentorship accelerate barn commissioning while protecting margin against commodity swings.
-
talent flywheel
Profit-sharing scorecards and structured mentorship produce owner-operators who stay to scale the network.
-
Replication-ready economics
Standardized 18-barn campuses plus shared services support a 10-site rollout targeting a $200M+ valuation.
2. Operating Model
A lean team of 19 employees runs the mixed-species complex. Profit-sharing scorecards, continuous-improvement rituals, and mentorship pipelines surface frontline insights directly into capital planning.
2.1 Workforce Plan
| Function | FTE | Key Duties |
|---|---|---|
| Chicken broiler barns | 3 | Feeding, welfare, catch/load coordination |
| Chicken layer barns | 2 | Egg collection, nesting care |
| Duck broiler barns | 2 | Water system upkeep, welfare |
| Duck layer barns | 2 | Egg collection, flock health |
| Rabbit barns (6 units) | 2 | Colony care, breeding management |
| Hatchery | 2 | Set, candle, pull, chick/duckling dispatch |
| Processor | 4 | Humane slaughter, evisceration, fabrication |
| Warehouse & logistics | 2 | Cold storage, order prep, deliveries |
| Total | 19 | — |
Compensation progression
Ontario's wage floor of $17.20/hr sets the baseline. Year 1 base rates reflect current CAD payroll allocations, while the employee pool (~$389K annually, ≈$20,487 per FTE) lifts total compensation well above starting salaries.
| Team lane | FTE | Year 1 base | Year 3 base | Year 5 base | Profit share / FTE | Profit share / team |
|---|---|---|---|---|---|---|
| Chicken broiler barns | 3 | $17.50/hr $36,400/yr ≈$56,887 with profit share |
$18.90/hr $39,312/yr ≈$59,799 with profit share |
$20.30/hr $42,224/yr ≈$62,711 with profit share |
≈$20,487 FY1 allocation |
≈$61,460 Shared across 3 |
| Chicken layer barns | 2 | $16.50/hr $34,320/yr ≈$54,807 with profit share |
$17.82/hr $37,066/yr ≈$57,553 with profit share |
$19.14/hr $39,811/yr ≈$60,298 with profit share |
≈$20,487 FY1 allocation |
≈$40,980 Shared across 2 |
| Duck broiler barns | 2 | $17.00/hr $35,360/yr ≈$55,847 with profit share |
$18.37/hr $38,189/yr ≈$58,676 with profit share |
$19.72/hr $41,018/yr ≈$61,505 with profit share |
≈$20,487 FY1 allocation |
≈$40,980 Shared across 2 |
| Duck layer barns | 2 | $16.50/hr $34,320/yr ≈$54,807 with profit share |
$17.82/hr $37,066/yr ≈$57,553 with profit share |
$19.14/hr $39,811/yr ≈$60,298 with profit share |
≈$20,487 FY1 allocation |
≈$40,980 Shared across 2 |
| Rabbit barns | 2 | $16.92/hr $35,200/yr ≈$55,687 with profit share |
$18.28/hr $38,016/yr ≈$58,503 with profit share |
$19.63/hr $40,832/yr ≈$61,319 with profit share |
≈$20,487 FY1 allocation |
≈$40,980 Shared across 2 |
| Hatchery | 2 | $17.00/hr $35,360/yr ≈$55,847 with profit share |
$18.37/hr $38,189/yr ≈$58,676 with profit share |
$19.72/hr $41,018/yr ≈$61,505 with profit share |
≈$20,487 FY1 allocation |
≈$40,980 Shared across 2 |
| Processor | 4 | $15.79/hr $32,840/yr ≈$53,327 with profit share |
$17.05/hr $35,467/yr ≈$55,954 with profit share |
$18.32/hr $38,098/yr ≈$58,585 with profit share |
≈$20,487 FY1 allocation |
≈$81,950 Shared across 4 |
| Warehouse & logistics | 2 | $15.47/hr $32,188/yr ≈$52,675 with profit share |
$16.71/hr $34,763/yr ≈$55,250 with profit share |
$17.96/hr $37,340/yr ≈$57,827 with profit share |
≈$20,487 FY1 allocation |
≈$40,980 Shared across 2 |
Compensation Summary
Base wages: $654,056/year (average $34,424 per FTE). Profit share: $389,248/year (average $20,487 per FTE). Total average compensation: ~$54,911 per employee.
2.2 Circular Fertilizer Program
Poultry litter, rabbit manure, and spent bedding are aerated with biochar to produce roughly 6,000 tonnes of composted fertilizer per year. Ontario market demand for regenerative soil amendments supports a $70 per tonne selling price, yielding $420,000 in annual revenue after certification testing and bagging.
A small packaging crew and third-party hauling add $75,000 in annual operating expense, but the closed-loop program keeps waste out of landfill, underpins OrganaCana Farms Organic Campus soil health, and creates a branded input for partner farms.
3. Financial Summary
3.1 Current Site Performance
| Metric | Value |
|---|---|
| Gross revenue | $6,142,000 per year |
| Operating net profit (pre-CAPEX) | $3,892,481 per year |
| Average employee compensation | ~$54,911 per year |
| CAPEX facility | $7M per site (0% interest, 7-year straight-line) |
3.2 Unit Economics & P&L
| Metric | Value |
|---|---|
| Gross revenue | $6,142,000 |
| Operating expenses | $2,249,519 |
| Net operating profit (pre-CAPEX) | $3,892,481 |
| Net operating profit (post-CAPEX) | $4,892,481 |
| EBITDA margin (pre-CAPEX) | 63% |
| EBITDA margin (post-CAPEX) | 80% |
3.3 Revenue Composition
| Barn Group | Gross Revenue |
|---|---|
| 3 chicken broiler barns | $1,102,000 |
| 3 chicken egg barns | $495,000 |
| 3 duck broiler barns | $1,462,500 |
| 3 duck egg barns | $742,500 |
| 6 rabbit barns | $1,920,000 |
| Circular fertilizer products | $420,000 |
| Total | $6,142,000 |
Composting output: ~6,000 tonnes per year sold at $70 per tonne equals $420,000 of recurring revenue.
3.4 Capital Requirements
- $7M umbrella facility per site at 0% interest, repaid $1M annually over seven years.
- Construction sequencing activates barns, processor, and cold storage inside the first operating year.
- Appendix B details per-barn capital requirements.
| Project Element | Low Estimate | High Estimate |
|---|---|---|
| 18 barns | $3,510,000 | $5,940,000 |
| Processor & cold storage | $1,250,000 | $2,500,000 |
| Site total | $4,760,000 | $8,440,000 |
3.5 ROI Pathway
The chart below stages gross revenue and net profit through the first four operating years as barns, processing, and distribution come online. It also tracks the $7M CAPEX balance alongside the proportional allocations. CAPEX amortizes evenly over seven years; once repaid, net profit and each profit-share bucket gain the full $1M annual lift.
4. Profit Distribution
Net operating profit is distributed through a transparent waterfall that funds shareholder returns, an employee profit pool distributed quarterly, research, and reinvestment. The breakdown below shows each allocation at the site's steady-state operating profit.
4.1 Profit Distribution Waterfall
| Category | Share | Allocation (Pre-CAPEX) | Notes |
|---|---|---|---|
| Shareholder dividends (ownership) | 20% | $778,496 | Stable annual return |
| Employee equity & profit pool | 10% | $389,248 | Distributed quarterly |
| Research & technology | 7% | $272,474 | Productivity & sustainability capex |
| Management participation | 6% | $233,549 | Leadership incentives & training |
| Community fund | 2% | $77,850 | Local community commitments |
| CAPEX repayment | Fixed | $1,000,000 | Straight-line $1M/year (0% interest) |
| Reinvestment & taxes (OrganaCana) | Residual | $1,140,864 | Retained earnings, tax reserve |
| Total net operating profit | 100% | $3,892,481 | — |
5. Growth Strategy
- Add one new site every 12–18 months via federated ownership and shared services.
- Maintain margin discipline through centralized procurement, training, and QA while preserving operator independence.
- Scale the mentorship pipeline so each entrant graduates with governance fluency and capital support.
5.1 Network Growth Projection (10-Year Horizon)
Projected site rollout drives a steady climb in gross revenue while profit shifts from repayment obligations to post-repayment upside.
| Year | Active Sites | Gross Revenue ($M) | Net Profit During Repayment ($M) | Net Profit Post-Repayment ($M) | Notes |
|---|---|---|---|---|---|
| 1 | 10 | 61.4 | 38.9 | — | All sites in repayment |
| 2 | 20 | 122.8 | 77.8 | — | All sites in repayment |
| 3 | 30 | 184.3 | 116.8 | — | All sites in repayment |
| 4 | 40 | 245.7 | 155.7 | — | All sites in repayment |
| 5 | 50 | 307.1 | 194.6 | — | All sites in repayment |
| 6 | 60 | 368.5 | 233.5 | — | All sites in repayment |
| 7 | 70 | 429.9 | 272.5 | — | All sites in repayment |
| 8 | 80 | 491.4 | 272.5 | 48.9 | First 10 sites post-repayment |
| 9 | 90 | 552.8 | 272.5 | 97.8 | Years 1–2 cohorts post-repayment |
| 10 | 100 | 614.2 | 272.5 | 146.7 | Years 1–3 cohorts post-repayment |
Total Year-10 net profit: ~$419.2M combining repayment and post-repayment cohorts.
5.2 ROI Milestones
- CAPEX balance clears by the end of Year 7; net profit rises from $3.89M to $4.89M beginning Year 8.
- Shareholder dividends increase from ~$778K to ~$978K per site post-repayment.
- Employee profit pool expands from ~$389K to ~$489K; management participation grows from ~$234K to ~$294K.
- Owner-operator share (26%) climbs from ~$1.01M to ~$1.27M annually once CAPEX is repaid.
6. Implementation Roadmap
- Quota & Compliance (Months 0–3): Secure New Entrant approvals, finalize biosecurity protocols, and file the charter.
- Capital Deployment (Months 3–12): Construct 18 barns plus processor and cold storage; sequence utilities, structures, and equipment for staged commissioning.
- Talent & Mentorship (Months 6–12): Recruit 19 FTEs, launch the mentorship cohort, and embed profit-sharing scorecards in onboarding.
- Closed-Loop Commissioning (Months 9–15): Synchronize hatchery-to-distribution workflow, activate waste-to-compost systems, and complete third-party food safety audits.
- Council Launch (Month 12): Seat representatives, approve R&D and community budgets, and publish the annual governance charter.
- Scale Replication (Months 12+): Package the site playbook, sponsor qualified employees into new entrant applications, and achieve 12–15% cost reductions on each subsequent build.
7. Appendices
Appendix A: Operating Expense Breakdown
Operating cost distribution highlights where $2.25M in annual site spend is concentrated.
Percentages reflect each category's share of steady-state operating expenses.
| Category | Annual OPEX |
|---|---|
| Feed and bedding | $850,463 |
| Utilities | $255,000 |
| Processing and packaging | $160,000 |
| Health and biosecurity | $70,000 |
| Repairs and maintenance | $185,000 |
| Fertilizer packaging & hauling | $75,000 |
| Labor (19 FTE @ $34,424) | $654,056 |
| Total | $2,249,519 |
Appendix B: Per-Barn Capital Detail
Capital mix (high estimate) emphasizes the dominance of building shells in per-barn budget planning.
Visualization uses the high-estimate scenario to illustrate allocation across major cost buckets.
| Category | Low Estimate | High Estimate |
|---|---|---|
| Site prep & utilities | $10,000 | $20,000 |
| Building construction | $150,000 | $250,000 |
| Equipment & systems | $30,000 | $50,000 |
| Permits & compliance | $5,000 | $10,000 |
| Per barn total | $195,000 | $330,000 |
Appendix C: Barn-Level Production Metrics
Revenue yield per barn shows rabbit and duck programs anchoring the production portfolio.
Chart depicts annual gross revenue contribution per barn across all livestock modalities.
| Barn Type | Units per Year (per barn) | Gross Revenue |
|---|---|---|
| Chicken broiler | 18,433 birds | $367,333 |
| Chicken layer (eggs) | 75,000 dozen | $165,000 |
| Duck broiler | 19,500 birds | $487,500 |
| Duck layer (eggs) | 75,000 dozen | $247,500 |
| Rabbit meat | 8,000 rabbits | $320,000 |
Appendix D: Image Gallery
Full-resolution visuals are presented in the image showcase near the beginning of this plan for quick reference during presentations or printouts.